library(ggplot2)
library(dplyr)

seed <- 2507
set.seed(seed)

a <- 1.5
b <- 2.0
sigma_y <- 3.5
mu_x <- 10
sigma_x <- 3

n <- 500

gen_data <- function(n, a, b, sigma_y, sigma_x, mu_x, prop_x = 0.3, prop_y = 0.5)  {
  x <- rnorm(n, mu_x, sigma_x)
  y <- a + b * x + rnorm(n, 0, sigma_y)

  lod_y <- quantile(y, prop_y, names = FALSE)
  lod_x <- quantile(x, prop_x, names = FALSE)

  x_obs <- pmax(lod_x, x)
  y_obs <- pmax(lod_y, y)

  df <- data.frame(x, y, x_obs, y_obs, lod_x, lod_y) |>
    mutate(x_cens = x_obs == lod_x,
           y_cens = y_obs == lod_y)
  return(df)
}

df <- gen_data(n, a, b, sigma_y, sigma_x, mu_x)

x_limit <- c(0, max(df$x_obs) * 1.02)
y_limit <- c(0, max(df$y_obs) * 1.02)

plot_bivariate_censoring <- function(df, xlimit, ylimit, lod_x, lod_y) {
  df |>
    ggplot(aes(x = x, y = y)) +
    annotate("rect", xmin = x_limit[1], xmax = lod_x, ymin = lod_y, ymax = y_limit[2], fill = "#dbdbdb", alpha = 0.8) +
    annotate("rect", xmin = x_limit[1], xmax = lod_x, ymin = x_limit[1], ymax = lod_y, fill = "#dbdbdb", alpha = 0.8) +
    annotate("rect", xmin = lod_x, xmax = x_limit[2], ymin = x_limit[1], ymax = lod_y, fill = "#dbdbdb", alpha = 0.8) +
    geom_point(data = dplyr::filter(df, x > lod_x, y > lod_y)) +
    geom_point(data = dplyr::filter(df, x <= lod_x | y <= lod_y), shape = 5) +
    geom_vline(xintercept = lod_x, linetype = 'dashed') +
    geom_hline(yintercept = lod_y, linetype = 'dashed') +
    annotate("text", x = lod_x / 2, y = (lod_y + y_limit[2]) / 2, label = "X censored, Y observed", size = 4) +
    annotate("text", x = lod_x / 2, y = lod_y / 2, label = "X censored, Y censored", size = 4) +
    annotate("text", x = (lod_x + x_limit[2]) / 2, y = lod_y / 2, label = "X observed, Y censored", size = 4) +
    annotate("text", x = x_limit[2], y = lod_y, label = "LOD of Y", vjust = -0.5, hjust = 1, size = 4) +
    annotate("text", x = lod_x, y = y_limit[2], label = "LOD of X", vjust = 1, hjust = -0.1, size = 4) +
    coord_cartesian(xlim = x_limit,
                    ylim = y_limit,
                    expand = FALSE, # prevent ggplot from adding extra space
                    clip = 'off') +   # allow the "LOD of Y" label to be drawn in the margin +
    labs(x = "X", y = "Y") +
    theme_minimal() +
    theme(axis.line = element_line(colour = "black", linewidth = rel(1)),
          panel.border = element_blank())
}

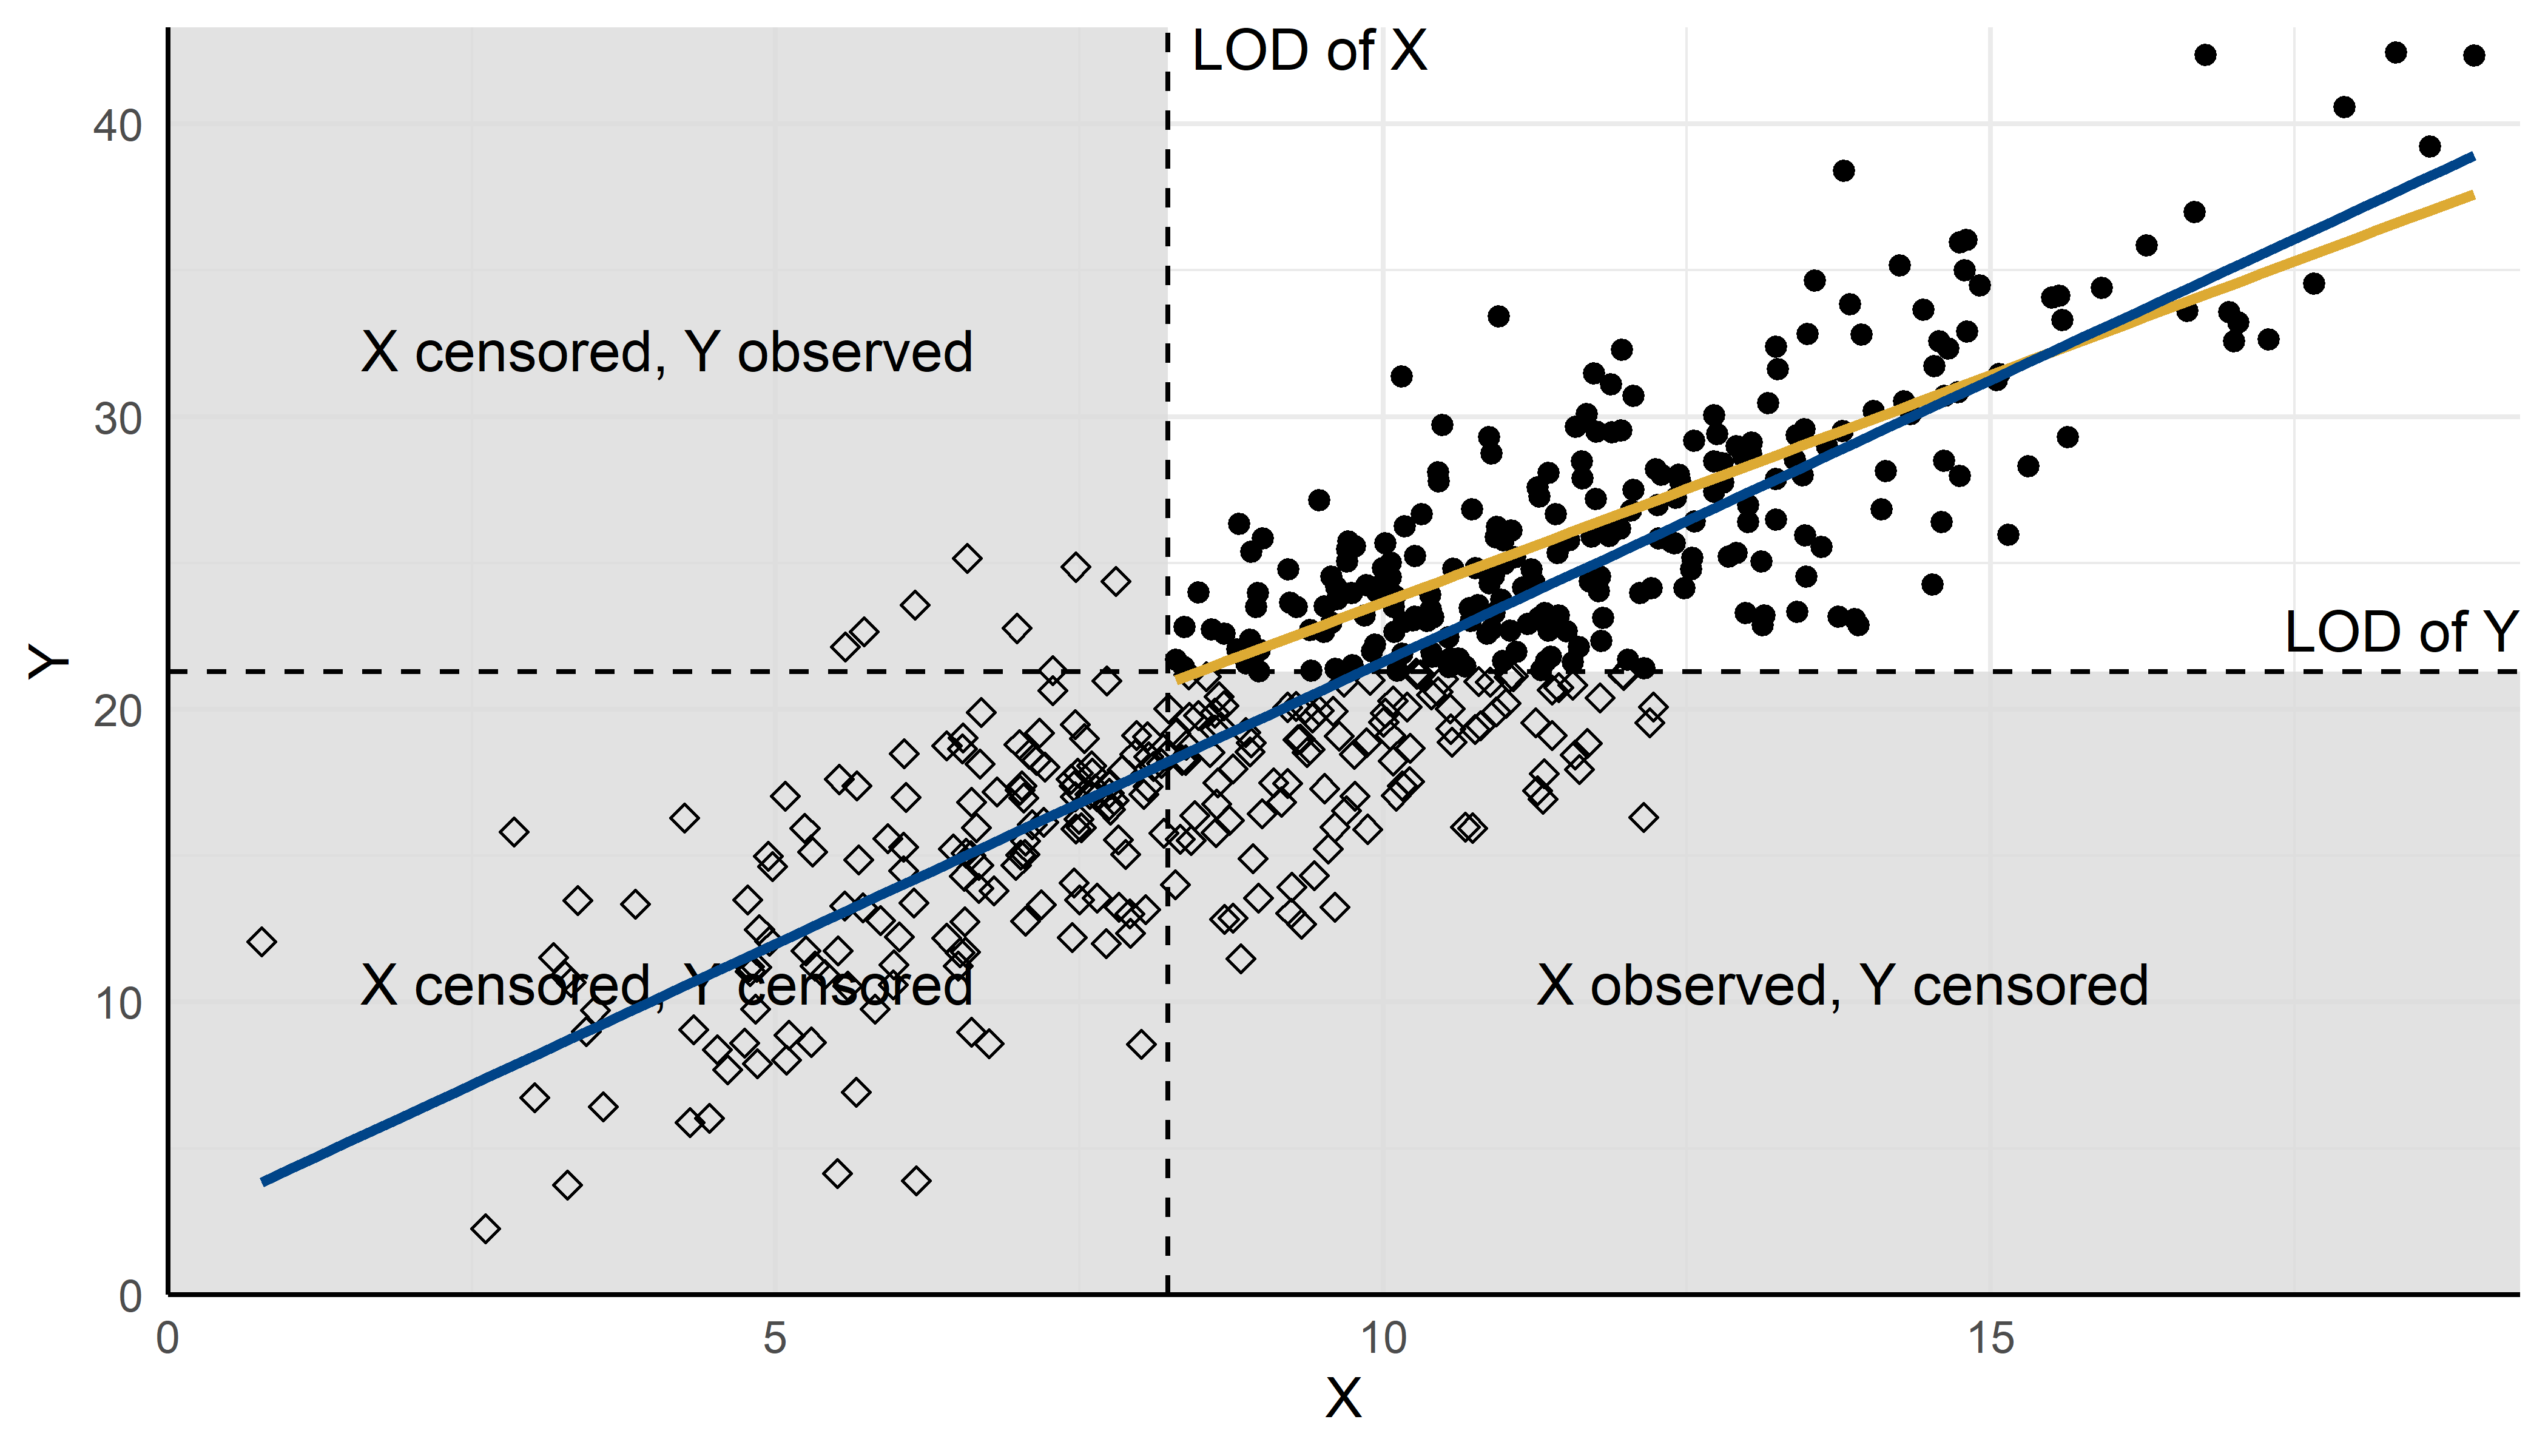
plot_bivariate_censoring(df, xlimit, ylimit, df$lod_x[1], df$lod_y[1]) +
  geom_smooth(data = dplyr::filter(df, !x_cens, !y_cens), method = 'lm',  color = '#DDAA33', se = FALSE) +
  geom_smooth(data = dplyr::filter(df), method = 'lm', color = '#004488', se = FALSE)