# Dutch colorectal incidence, mortality and population: download, check, cache.
#
# blog: a copy of the data script behind my report on colorectal cancer in the
# Netherlands, with only what the post needs changed; a changed line is marked
# `# blog:`. Like the original it is a SCRIPT: knitr's `file:` chunk option
# pastes these lines into the `nl-data` chunk of index.qmd and runs them in the
# post's own environment, where the top-level assignments are the point -- they
# leave the count tables behind for the chunks after it. Sourcing the file by
# hand does the same thing, and WILL hit the network if the cache below is
# missing.
#
# One source per quantity:
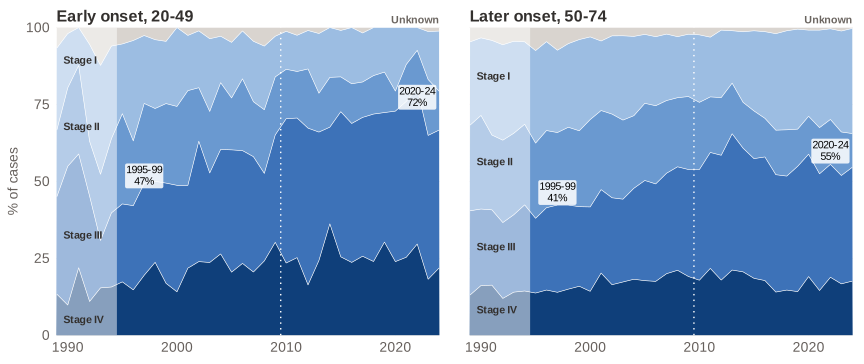
#   incidence   NKR-cijfers (IKNL), the public front end of the Netherlands
#               Cancer Registry: cases by year x sex x 5-year age group, for
#               colon, appendix and rectum separately, and for the
#               gastrointestinal neuroendocrine tumours (NETs), which NKR
#               counts as a group of their own; and by stage, for colon and
#               rectum together and apart (blog: apart is not in the report)
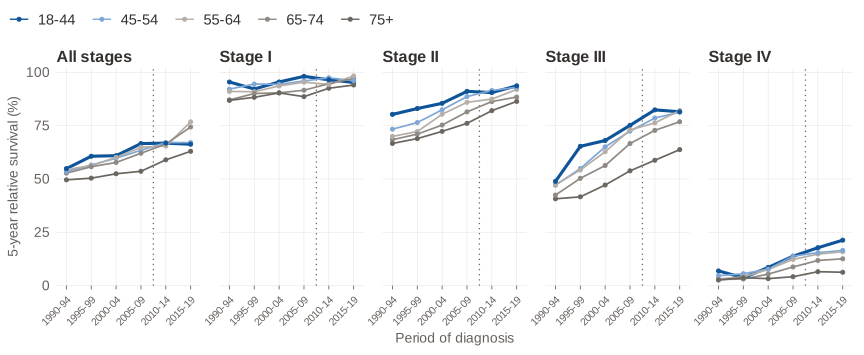
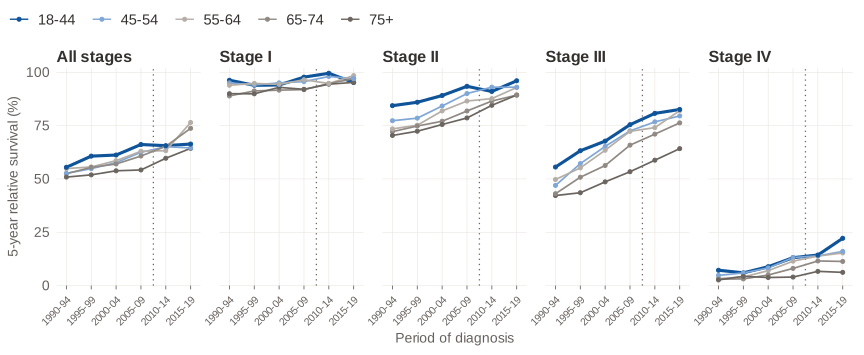
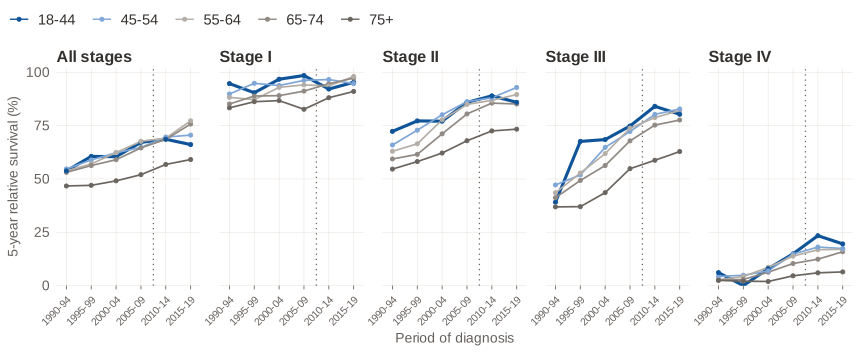
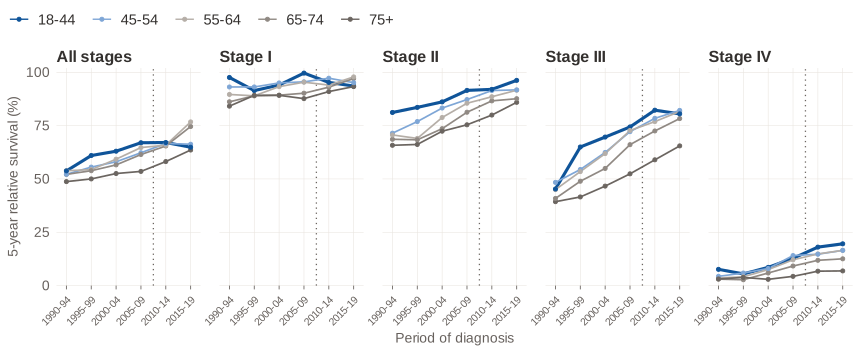
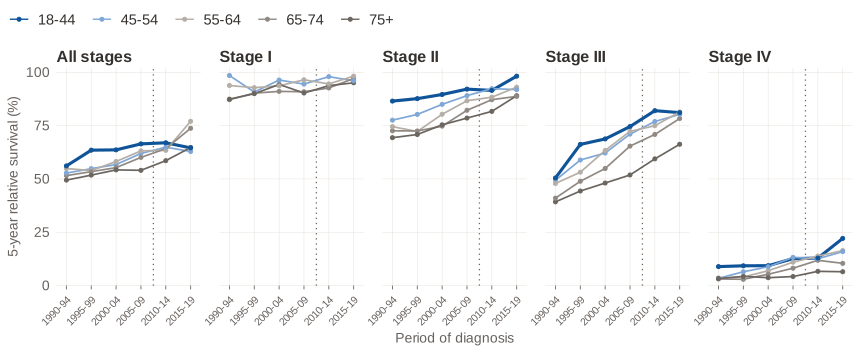
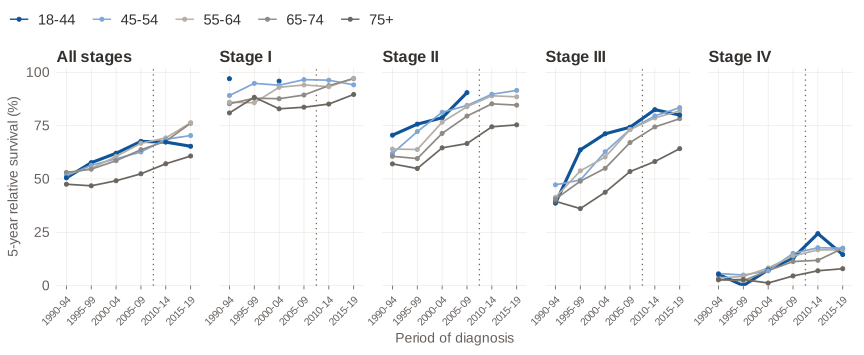
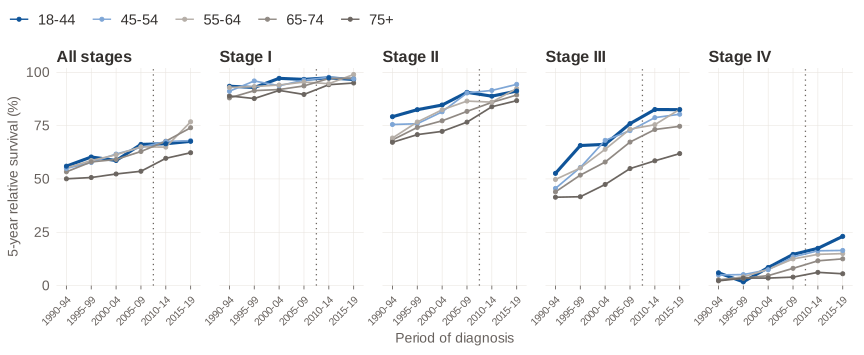
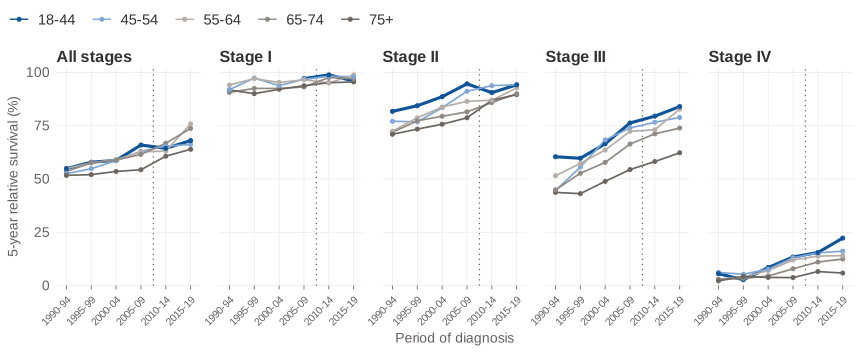
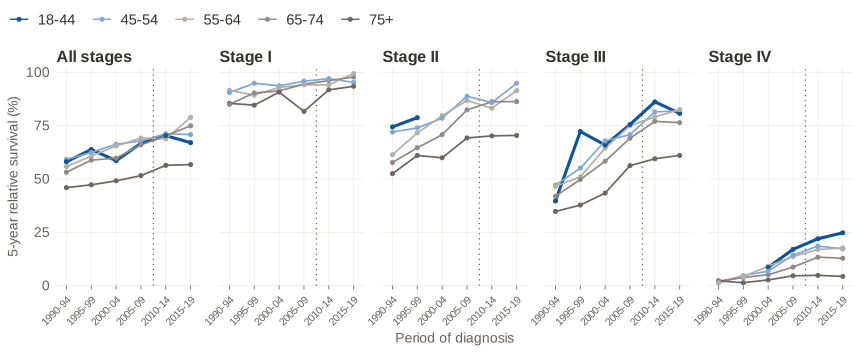
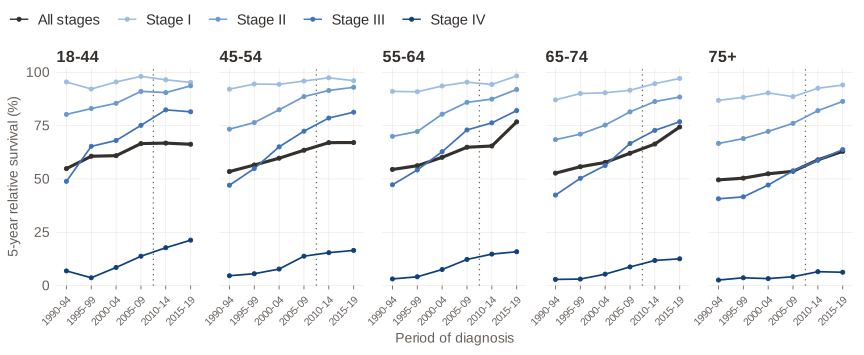
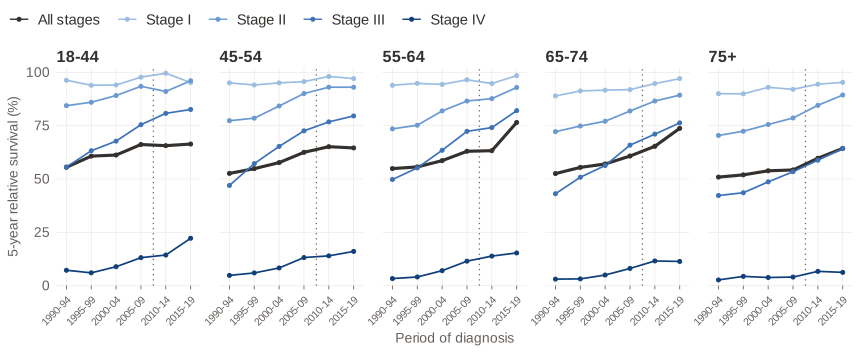
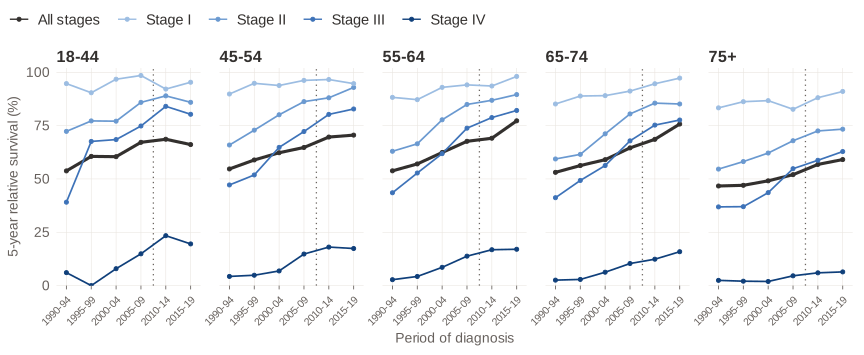
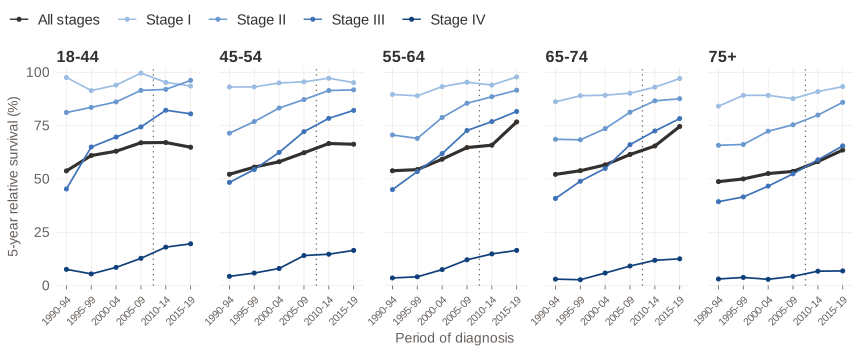
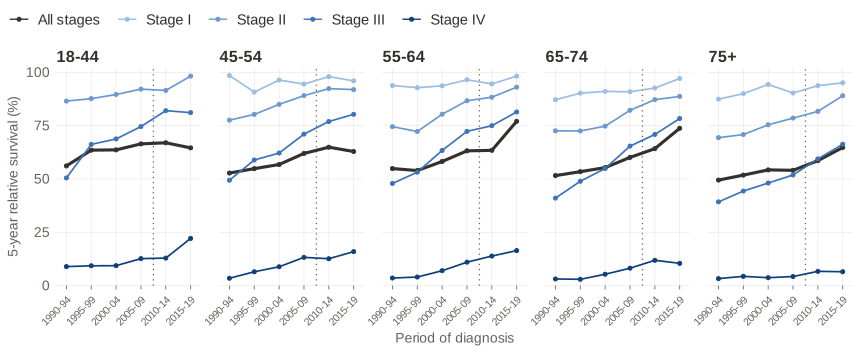
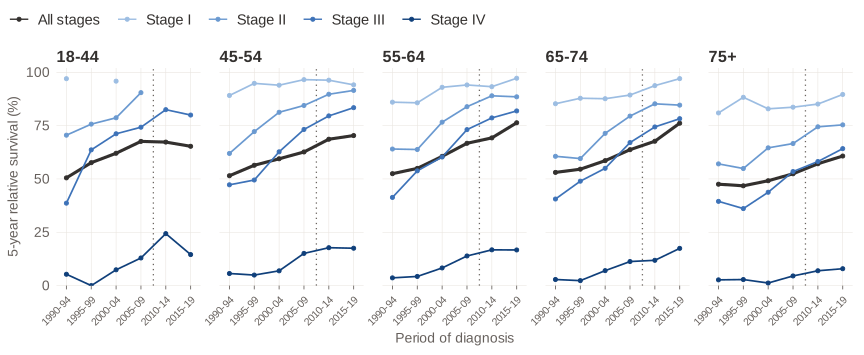
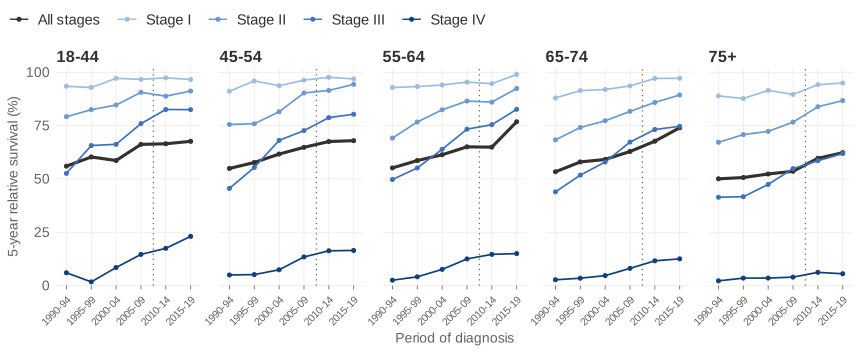
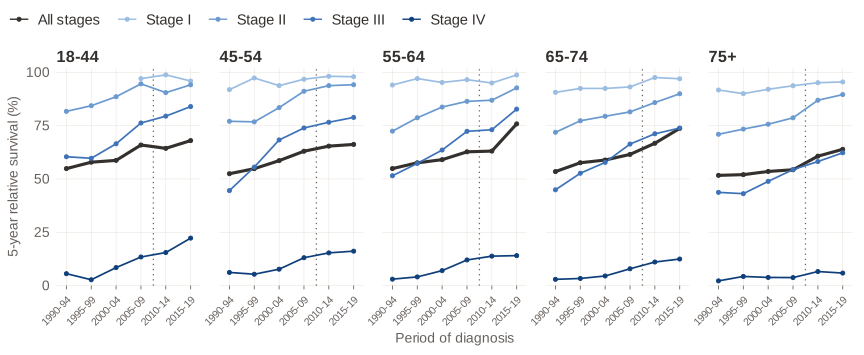
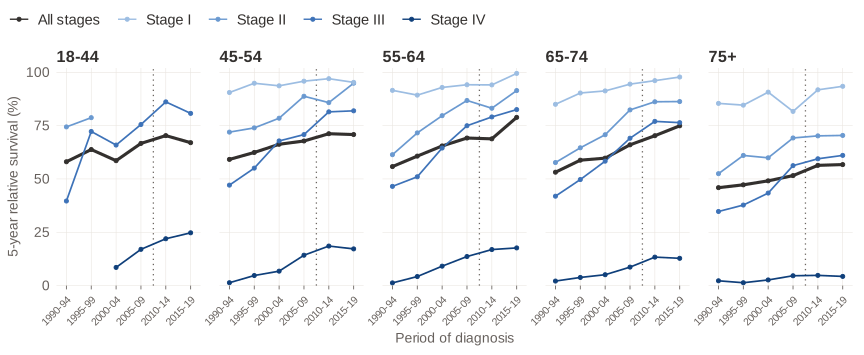
#   survival    NKR-cijfers again (blog: not in the report): relative survival
#               of colon and rectum, together and apart, by 5-year period x
#               NKR's age group x stage
#   mortality   WHO Mortality Database, the Netherlands (4210): deaths by
#               underlying cause at four ICD-10 characters, as CBS reports them,
#               and the C26 deaths (digestive organs, ill-defined) beside them
#   population  CBS StatLine 03759ned: the population on 1 January by sex and
#               single year of age, averaged over 1 January of the year and of
#               the next -- ONE denominator for both outcomes
#
# Each source is fetched as far back as it goes, from NL_FIRST_YEAR at the
# earliest: NKR from 1989, WHO's ICD-10 deaths from 1996, CBS from 1988.
#
# Expects, from the setup chunk:
#   N_AGEGRP, sex_labels, NL_FIRST_YEAR, NKR_KEEP_PRELIMINARY, ua_handle()
# Leaves behind:
#   nl_nkr       the NKR extract: `nkr`, cases per year x sex x agegrp x code
#                with a `preliminary` flag on the years NKR calls provisional;
#                `net`, the same for the GI NETs; and `published`, NKR's own
#                series, kept only to check against
#   nl_stage     `stage`, per site (colon and rectum, appendix excluded; colon;
#                rectum) x year x sex x agegrp x stage, with NKR's suppressed
#                rows as NA (see nkr_stage_cells)
#   nl_surv      `survival`, per site as `stage`, for both sexes and per sex:
#                relative survival in % per period x years after diagnosis x
#                age x stage, with the patients still at risk; cells NKR hides
#                as NA (see nkr_fetch_survival)
#   nl_who       the WHO extract: `deaths`, WHO's own population, unknown ages,
#                and `c26`, the C26 deaths -- NOT part of mort_codes
#   nl_cbs       `cbs_pop`, the CBS population on the 18 bands
#   inc_codes, mort_codes   the two count tables, one row per year x sex x
#                agegrp x code, with the CBS population beside each count
#   net_codes    the GI NETs in the same shape, code "NET (GI)" -- NOT part of
#                inc_codes
#   c26_codes    the C26 deaths in the same shape -- NOT part of mort_codes
# Each of the three extracts carries `fetched`, the day it was downloaded.
# Touches on disk:
#   data/*.parquet, next to this file -- per source: a source whose files are
#   all present, and were fetched from the same NL_FIRST_YEAR, is read; any
#   other is downloaded again and rewritten. Delete one source's files to
#   refresh that source alone.
#
# Every call is namespace-qualified, so nothing has to be attached first.

stopifnot(
  "nl-data.R expects the setup chunk's constants (N_AGEGRP, sex_labels, NL_FIRST_YEAR, NKR_KEEP_PRELIMINARY, ua_handle)" =
    all(vapply(c("N_AGEGRP", "sex_labels", "NL_FIRST_YEAR",
                 "NKR_KEEP_PRELIMINARY", "ua_handle"),
               \(n) exists(n, inherits = TRUE), logical(1))))

# ---- where the extracts are kept ---------------------------------------------
# Parquet, gzip: nanoparquet 0.5.0 accepts "zstd" and then writes the file
# uncompressed.
# blog: in the post's own folder -- Quarto runs the post from there -- rather
# than in the report repository's data/netherlands.
NL_DIR   <- "data"
NL_CACHE <- list(
  nkr = c(nkr       = file.path(NL_DIR, "nkr_incidence.parquet"),
          net       = file.path(NL_DIR, "nkr_net.parquet"),
          published = file.path(NL_DIR, "nkr_published.parquet")),
  # blog: stage and survival per site, each a source of its own, so fetching
  # them did not re-fetch the incidence
  stage = c(stage = file.path(NL_DIR, "nkr_stage_sites.parquet")),
  surv = c(survival = file.path(NL_DIR, "nkr_survival_sites_sexes.parquet")),
  who = c(deaths    = file.path(NL_DIR, "who_nl_deaths.parquet"),
          who_pop   = file.path(NL_DIR, "who_nl_pop.parquet"),
          unknown   = file.path(NL_DIR, "who_nl_unknown_age.parquet"),
          c26       = file.path(NL_DIR, "who_nl_c26.parquet")),
  cbs = c(cbs_pop   = file.path(NL_DIR, "cbs_population.parquet")))

# One source's tables: read them if every file is there and was fetched from
# the NL_FIRST_YEAR asked for now, otherwise run `fetch` and write what it
# returns. all(), not any(): a half-written source must re-fetch rather than
# read the part of itself that happens to be on disk. The day of the download
# and the first year ride in the first file's key-value metadata, as the WHO
# cache does it, rather than as columns repeated on every row.
nl_cached <- function(source, fetch) {
  files <- NL_CACHE[[source]]
  if (all(file.exists(files))) {
    kv <- nanoparquet::read_parquet_metadata(
      files[[1]])$file_meta_data$key_value_metadata[[1]]
    meta <- \(k) kv$value[kv$key == k]
    if (identical(meta("first_year"), as.character(NL_FIRST_YEAR))) {
      out <- lapply(files, \(f) tibble::as_tibble(nanoparquet::read_parquet(f)))
      out$fetched <- as.Date(meta("fetched"))
      return(out)
    }
  }
  out <- fetch()
  dir.create(NL_DIR, showWarnings = FALSE, recursive = TRUE)
  for (nm in names(files))
    nanoparquet::write_parquet(
      out[[nm]], files[[nm]], compression = "gzip",
      metadata = if (nm == names(files)[1])
        c(fetched = as.character(Sys.Date()), first_year = as.character(NL_FIRST_YEAR)))
  out$fetched <- Sys.Date()
  out
}

# ---- NKR-cijfers ---------------------------------------------------------------
# The site runs on an undocumented JSON API.
# blog: found by reading the site's JavaScript bundle. Two endpoints, both POST:
# `filter-groups` lists every filter and its codes, `data` returns the cells.
NKR_API <- "https://api.nkr-cijfers.iknl.nl/api"

# NKR's cancer types and the ICD-10 codes they stand for. NKR classifies a
# tumour on site AND morphology, and keeps the gastrointestinal neuroendocrine
# tumours in a group of their own (subgroep/220000), so each of these three is
# the non-NET tumours of its site. That the rectum is C19-C20 and not C20 alone
# was checked against CI5 XII, whose rectum is C19-C20 by definition: for
# 2013-2017 the two differ by 2% (23,600 against 23,141). Among the Dutch
# deaths of those years C19 is about one in ten of C19-C20, so a rectum
# without it would sit well below CI5's.
#
# The `code` column is what the rest of the post reads. The appendix is
# labelled C181 on purpose -- APPENDIX in the setup chunk -- so it is taken out
# the same way in the cases and in the deaths; the other two carry labels that
# say what they hold rather than pretending to be a single ICD-10 code.
NKR_SITES <- tibble::tribble(
  ~nkr_code,             ~code,            ~nkr_label,
  "kankersoort/205310",  "C18 excl. C181", "Dikkedarmkanker",
  "kankersoort/205320",  "C181",           "Appendixkanker",
  "kankersoort/205330",  "C19-C20",        "Endeldarmkanker")

# The NETs: every site of the digestive tract in one group, which NKR does not
# split by site -- stomach, small bowel, appendix, colon and rectum alike.
NKR_NET <- tibble::tibble(nkr_code = "kankersoort/subgroep/220000",
                          code = "NET (GI)",
                          nkr_label = "Gastrointestinale neuroendocriene tumoren")

NKR_SEXES <- c("geslacht/man" = "Men", "geslacht/vrouw" = "Women")

# The 18 five-year bands, in agegrp order: "00-04jr" .. "80-84jr", then "85-".
NKR_AGES <- c(sprintf("leeftijdsgroep/5-jaar/%02d-%02djr",
                      seq(0, 80, 5), seq(4, 84, 5)),
              "leeftijdsgroep/5-jaar/85-")

nkr_post <- function(path, body) {
  h <- ua_handle()
  curl::handle_setheaders(h, "Content-Type" = "application/json")
  curl::handle_setopt(h, postfields = as.character(
    jsonlite::toJSON(body, auto_unbox = TRUE)))
  res <- curl::curl_fetch_memory(paste0(NKR_API, "/", path, "?format=json"),
                                 handle = h)
  if (res$status_code != 200)
    stop("NKR-cijfers answered ", res$status_code, " on ", path)
  jsonlite::fromJSON(rawToChar(res$content), simplifyVector = FALSE)
}

# Values held fixed in every request: the whole country, every stage.
nkr_fixed <- function(...) c(
  list(...),
  list(list(code = "filter/regio",  values = list(list(code = "regio/totaal/alle"))),
       list(code = "filter/stadium", values = list(list(code = "stadium/totaal/alle")))))

nkr_values <- function(codes) lapply(codes, \(x) list(code = x))

# Which years a page has, and which of them NKR calls provisional -- read off
# the year filter's own remarks, so the flag follows NKR when a year is
# finalised rather than being a year typed in here.
nkr_years <- function(navigation = "incidentie/periode",
                      filter = "filter/periode-van-diagnose") {
  fg <- nkr_post("filter-groups", list(
    currentNavigation = list(code = navigation), language = "nl-NL",
    filterValuesSelected = list(), userAction = list(code = "restart", value = "")))
  flt <- purrr::keep(purrr::list_flatten(purrr::map(fg$filterGroups, "filters")),
                     \(f) identical(f$code, filter))
  stopifnot("NKR-cijfers has no such year filter on that page" = length(flt) == 1)
  leaves <- function(v) purrr::list_flatten(purrr::map(v, \(x)
    if (length(x$children)) leaves(x$children) else list(x)))
  purrr::map(leaves(flt[[1]]$values), \(x) tibble::tibble(
    year = as.integer(sub(".*/", "", x$code)),
    preliminary = any(purrr::map_chr(x$remarks, "code") == "data/preliminary"))) |>
    purrr::list_rbind()
}

# One request per site x sex: every year by every age group. A cell comes back
# with a `state`; anything other than "data/valid" would be a cell NKR has
# suppressed or flagged, and is stopped on below rather than read as a count.
nkr_cells <- function(site, sex, years) {
  d <- nkr_post("data", list(
    language = "nl-NL", navigation = list(code = "incidentie/periode"),
    statistic = list(code = "statistiek/aantal"),
    groupBy = list(
      list(code = "filter/periode-van-diagnose",
           values = nkr_values(paste0("periode/1-jaar/", years))),
      list(code = "filter/leeftijdsgroep", values = nkr_values(NKR_AGES))),
    aggregateBy = nkr_fixed(
      list(code = "filter/kankersoort", values = nkr_values(site)),
      list(code = "filter/geslacht",    values = nkr_values(sex)))))$data
  purrr::map(d, \(r) {
    fv <- purrr::map_chr(r$filterValues, "code")
    tibble::tibble(year   = as.integer(sub(".*/", "", fv[startsWith(fv, "periode/")])),
                   agegrp = match(fv[startsWith(fv, "leeftijdsgroep/")], NKR_AGES),
                   cases  = r$value %||% NA_real_,
                   state  = r$state %||% NA_character_)
  }) |>
    purrr::list_rbind() |>
    dplyr::mutate(nkr_code = site, sex = NKR_SEXES[[sex]])
}

# The same site x sex at all ages, one number per year: what the age groups
# above must add up to. A registry that rounded or perturbed small cells would
# fail this, so it is the check that the counts are counts.
nkr_totals <- function(site, sex, years) {
  d <- nkr_post("data", list(
    language = "nl-NL", navigation = list(code = "incidentie/periode"),
    statistic = list(code = "statistiek/aantal"),
    groupBy = list(list(code = "filter/periode-van-diagnose",
                        values = nkr_values(paste0("periode/1-jaar/", years)))),
    aggregateBy = nkr_fixed(
      list(code = "filter/kankersoort",    values = nkr_values(site)),
      list(code = "filter/geslacht",       values = nkr_values(sex)),
      list(code = "filter/leeftijdsgroep", values = nkr_values("leeftijdsgroep/totaal/alle")))))$data
  purrr::map(d, \(r) tibble::tibble(
    year  = as.integer(sub(".*/", "", purrr::map_chr(r$filterValues, "code"))),
    total = r$value %||% NA_real_)) |>
    purrr::list_rbind() |>
    dplyr::mutate(nkr_code = site, sex = NKR_SEXES[[sex]])
}

# NKR's own published numbers, fetched only to be checked against: the world
# (Segi) standardised incidence rate of all colorectal cancer, persons, and the
# colorectal deaths NKR shows from the CBS cause-of-death statistics.
nkr_published <- function(years) {
  wsr <- nkr_post("data", list(
    language = "nl-NL", navigation = list(code = "incidentie/periode"),
    statistic = list(code = "statistiek/wsr"),
    groupBy = list(list(code = "filter/periode-van-diagnose",
                        values = nkr_values(paste0("periode/1-jaar/", years)))),
    aggregateBy = nkr_fixed(
      list(code = "filter/kankersoort",    values = nkr_values("kankersoort/subgroep/205000")),
      list(code = "filter/geslacht",       values = nkr_values("geslacht/totaal/alle")),
      list(code = "filter/leeftijdsgroep", values = nkr_values("leeftijdsgroep/totaal/alle")))))$data
  # Deaths: CBS splits colorectal into C18 with the appendix, C20 and C19, and
  # its years run on their own calendar, so they are asked for, not assumed.
  dy <- nkr_years("sterfte/periode", "filter/jaar-van-overlijden")
  death_years <- dy$year[dy$year >= NL_FIRST_YEAR]
  deaths <- nkr_post("data", list(
    language = "nl-NL", navigation = list(code = "sterfte/periode"),
    statistic = list(code = "statistiek/aantal"),
    groupBy = list(
      list(code = "filter/jaar-van-overlijden",
           values = nkr_values(paste0("periode/1-jaar/", death_years))),
      list(code = "filter/kankersoortCBS",
           values = nkr_values(paste0("kankersoortCBS/", c("205310", "205330", "205340"))))),
    aggregateBy = list(
      list(code = "filter/geslacht",       values = nkr_values("geslacht/totaal/alle")),
      list(code = "filter/leeftijdsgroep", values = nkr_values("leeftijdsgroep/totaal/alle")))))$data
  year_of <- \(r) as.integer(sub(".*/", "", purrr::keep(
    purrr::map_chr(r$filterValues, "code"), \(x) startsWith(x, "periode/"))))
  dplyr::bind_rows(
    purrr::map(wsr, \(r) tibble::tibble(
      measure = "incidence WSR, C18-C20, persons", year = year_of(r),
      value = r$value %||% NA_real_)) |> purrr::list_rbind(),
    purrr::map(deaths, \(r) tibble::tibble(
      measure = "deaths, C18-C20 (CBS)", year = year_of(r),
      value = r$value %||% NA_real_)) |> purrr::list_rbind() |>
      dplyr::summarise(value = sum(value), .by = c(measure, year)))
}

# Every cell of a set of NKR groups, held to the checks: valid, present, whole,
# and adding up to NKR's own all-ages totals.
nkr_fetch_groups <- function(groups, yrs) {
  years <- yrs$year
  grid  <- tidyr::expand_grid(site = groups$nkr_code, sex = names(NKR_SEXES))

  cells  <- purrr::pmap(grid, \(site, sex) nkr_cells(site, sex, years)) |>
    purrr::list_rbind()
  totals <- purrr::pmap(grid, \(site, sex) nkr_totals(site, sex, years)) |>
    purrr::list_rbind()

  stopifnot(
    "an NKR cell is not marked valid (suppressed or flagged?)" =
      all(cells$state == "data/valid"),
    "an NKR cell came back without a number" = !anyNA(cells$cases),
    "an NKR age group did not match one of the 18 bands" = !anyNA(cells$agegrp),
    # every site x sex x year x band, once
    "NKR did not return the full year x age grid" =
      nrow(cells) == nrow(grid) * length(years) * N_AGEGRP &&
      nrow(dplyr::distinct(cells, nkr_code, sex, year, agegrp)) == nrow(cells),
    "an NKR count is not a whole number" = all(cells$cases == round(cells$cases)))

  gap <- cells |>
    dplyr::summarise(by_age = sum(cases), .by = c(nkr_code, sex, year)) |>
    dplyr::full_join(totals, by = c("nkr_code", "sex", "year"))
  stopifnot("NKR's age groups do not add up to its all-ages total" =
              isTRUE(all(gap$by_age == gap$total)))

  cells |>
    dplyr::inner_join(groups, by = "nkr_code") |>
    dplyr::left_join(yrs, by = "year") |>
    dplyr::transmute(year, preliminary, sex, agegrp = as.integer(agegrp),
                     code, cases)
}

# ---- stage --------------------------------------------------------------------
# Colon and rectum together (NKR sums the two codes when both are in
# aggregateBy), so the appendix is out, as in the main incidence; and, blog:
# colon and rectum apart. Together is asked for rather than added up from the
# two: NKR hides a row by its own size, so the sum of two rows it shows can
# be a row it would show, while either part alone is hidden. Per sex, because
# Persons is built from the sexes, as everywhere else.
#
# The stage is "stage at diagnosis, by the classification valid at the time"
# (NKR-cijfers' own description of the filter): the TNM edition in force in the
# year of diagnosis, pathological stage first and clinical where that is missing
# (Brouwer et al., Int J Cancer 2018). Stage 0 is non-invasive and NVT "no stage
# classification"; both are asked for so the check below sees every case.
NKR_STAGES <- c("stadium/0" = "0", "stadium/i" = "I", "stadium/ii" = "II",
                "stadium/iii" = "III", "stadium/iv" = "IV",
                "stadium/x" = "Unknown", "stadium/nvt" = "NVT")

# NKR hides small cells. In this table it hides WHOLE ROWS -- every stage of one
# year x sex x age group at once, roughly when that row holds 10 cases or fewer
# -- and a hidden row comes back as "data/undisclosed" with no value. Those
# cells are kept as NA rather than worked out from the totals.
# blog: the post uses stage from 20-24 up, and fills in the hidden rows itself
# (the `stage` chunk of index.qmd).
# The provisional year is not asked for; NKR discloses no stage for it.
# blog: the sites, by their NKR codes and the codes of the incidence counts
# their stages must add up to.
NKR_STAGE_SITES <- list(
  `Colon and rectum` = c("kankersoort/205310", "kankersoort/205330"),
  Colon              = "kankersoort/205310",
  Rectum             = "kankersoort/205330")
nkr_site_codes <- \(site) NKR_SITES$code[match(NKR_STAGE_SITES[[site]], NKR_SITES$nkr_code)]

nkr_stage_cells <- function(site, sex, years) {
  d <- nkr_post("data", list(
    language = "nl-NL", navigation = list(code = "incidentie/periode"),
    statistic = list(code = "statistiek/aantal"),
    groupBy = list(
      list(code = "filter/periode-van-diagnose",
           values = nkr_values(paste0("periode/1-jaar/", years))),
      list(code = "filter/leeftijdsgroep", values = nkr_values(NKR_AGES)),
      list(code = "filter/stadium", values = nkr_values(names(NKR_STAGES)))),
    aggregateBy = list(
      list(code = "filter/kankersoort", values = nkr_values(NKR_STAGE_SITES[[site]])),
      list(code = "filter/geslacht", values = nkr_values(sex)),
      list(code = "filter/regio",    values = nkr_values("regio/totaal/alle")))))$data
  purrr::map(d, \(r) {
    fv <- purrr::map_chr(r$filterValues, "code")
    tibble::tibble(year   = as.integer(sub(".*/", "", fv[startsWith(fv, "periode/")])),
                   agegrp = match(fv[startsWith(fv, "leeftijdsgroep/")], NKR_AGES),
                   stage  = unname(NKR_STAGES[fv[startsWith(fv, "stadium/")]]),
                   cases  = r$value %||% NA_real_,
                   state  = r$state %||% NA_character_)
  }) |>
    purrr::list_rbind() |>
    dplyr::mutate(site = site, sex = NKR_SEXES[[sex]])
}

nkr_fetch_stage <- function(yrs, cases) {
  years <- yrs$year[!yrs$preliminary]
  cells <- tidyr::expand_grid(site = names(NKR_STAGE_SITES), sex = names(NKR_SEXES)) |>
    purrr::pmap(\(site, sex) nkr_stage_cells(site, sex, years)) |>
    purrr::list_rbind()

  totals <- purrr::map(names(NKR_STAGE_SITES), \(site) cases |>
    dplyr::filter(code %in% nkr_site_codes(site)) |>
    dplyr::summarise(total = sum(cases), .by = c(year, sex, agegrp)) |>
    dplyr::mutate(site = site)) |>
    purrr::list_rbind()
  rows <- cells |>
    dplyr::summarise(disclosed = all(state == "data/valid"),
                     hidden    = all(state == "data/undisclosed"),
                     by_stage  = sum(cases),
                     .by = c(site, year, sex, agegrp)) |>
    dplyr::left_join(totals, by = c("site", "year", "sex", "agegrp"))

  stopifnot(
    "an NKR stage cell is neither valid nor undisclosed" =
      all(cells$state %in% c("data/valid", "data/undisclosed")),
    "NKR did not return the full year x age x stage grid" =
      nrow(cells) == length(NKR_STAGE_SITES) * length(NKR_SEXES) * length(years) *
        N_AGEGRP * length(NKR_STAGES),
    "an NKR stage row is partly hidden; the post assumes whole rows" =
      all(rows$disclosed | rows$hidden),
    "a valid NKR stage cell came back without a number" =
      !anyNA(cells$cases[cells$state == "data/valid"]),
    # every disclosed row must hold exactly the cases of its site in the main
    # table, so stage splits the incidence the post already uses
    "NKR's stages do not add up to its cases of the site" =
      isTRUE(all(rows$by_stage[rows$disclosed] == rows$total[rows$disclosed])))

  cells |> dplyr::transmute(site, year, sex, agegrp = as.integer(agegrp), stage, cases)
}

fetch_nkr <- function() {
  yrs <- nkr_years() |> dplyr::filter(year >= NL_FIRST_YEAR)
  list(nkr       = nkr_fetch_groups(NKR_SITES, yrs),
       net       = nkr_fetch_groups(NKR_NET, yrs),
       published = nkr_published(yrs$year))
}

# ---- survival -----------------------------------------------------------------
# blog: not in the report. Relative survival per site, as for stage (colon and
# rectum together, so the appendix is out as in the incidence; colon; rectum),
# for both sexes and per sex, per 5-year period of diagnosis from 1990-94 (as
# the post's age-specific rates) x age x stage. Both sexes is NKR's own figure,
# not built from the sexes: relative survival does not add up.
#
# The survival page has age groups of its own (the ICSS groups, 18-44 .. 75+)
# and refuses the 5-year bands. And NKR builds a survival figure from the years
# after diagnosis it is asked for, multiplying their yearly survival: ask for
# year 5 alone and the answer is survival from year 4 to year 5. So every year
# from 0 is asked for, and year k is then k-year survival. The unknown stage is
# not asked for: NKR discloses most of its cells only in part.
NKR_SURV_AGES <- c("leeftijdsgroep/ICSS/18-44jr" = "18-44",
                   "leeftijdsgroep/ICSS/45-54jr" = "45-54",
                   "leeftijdsgroep/ICSS/55-64jr" = "55-64",
                   "leeftijdsgroep/ICSS/65-74jr" = "65-74",
                   "leeftijdsgroep/ICSS/75-"     = "75+")
NKR_SURV_STAGES <- c("stadium/totaal/alle" = "All", "stadium/i" = "I",
                     "stadium/ii" = "II", "stadium/iii" = "III", "stadium/iv" = "IV")
NKR_SURV_YEARS  <- 0:5

NKR_SURV_SEXES <- c("geslacht/totaal/alle" = "Persons", NKR_SEXES)

nkr_fetch_survival <- function(site, sex) {
  periods <- seq(1990L, 2020L, 5L)
  d <- nkr_post("data", list(
    language = "nl-NL", navigation = list(code = "overleving/periode"),
    statistic = list(code = "statistiek/relatieve-overleving"),
    groupBy = list(
      list(code = "filter/periode-van-diagnose",
           values = nkr_values(sprintf("periode/5-jaar/%d-%d", periods, periods + 4L))),
      list(code = "filter/jaren-na-diagnose",
           values = nkr_values(paste0("jaren-na-diagnose/", NKR_SURV_YEARS))),
      list(code = "filter/leeftijdsgroep", values = nkr_values(names(NKR_SURV_AGES))),
      list(code = "filter/stadium",        values = nkr_values(names(NKR_SURV_STAGES)))),
    aggregateBy = list(
      list(code = "filter/kankersoort", values = nkr_values(NKR_STAGE_SITES[[site]])),
      list(code = "filter/geslacht", values = nkr_values(sex)))))$data
  cells <- purrr::map(d, \(r) {
    fv <- purrr::set_names(purrr::map_chr(r$filterValues, "code"),
                           purrr::map_chr(r$filterValues, "filterCode"))
    n <- purrr::keep(r$metaData, \(m) identical(m$code, "metadata/number-of-patients"))
    tibble::tibble(
      period   = as.integer(substr(sub(".*/", "", fv[["filter/periode-van-diagnose"]]), 1, 4)),
      years    = as.integer(sub(".*/", "", fv[["filter/jaren-na-diagnose"]])),
      age      = unname(NKR_SURV_AGES[fv[["filter/leeftijdsgroep"]]]),
      stage    = unname(NKR_SURV_STAGES[fv[["filter/stadium"]]]),
      survival = r$value %||% NA_real_,
      at_risk  = if (length(n)) n[[1]]$value else NA_real_,
      state    = r$state %||% NA_character_)
  }) |>
    purrr::list_rbind()

  # blog: per site and sex the NKR hides some cells -- small groups, such as
  # the rectum at 18-44, stage II, 2020-24 -- whole, at every year after
  # diagnosis; they are kept as NA, and the post decides what to do with them.
  valid <- cells$state == "data/valid"
  stopifnot(
    "an NKR survival cell is neither valid nor undisclosed" =
      all(cells$state %in% c("data/valid", "data/undisclosed")),
    "NKR did not return the full period x years x age x stage grid" =
      nrow(cells) == length(periods) * length(NKR_SURV_YEARS) *
        length(NKR_SURV_AGES) * length(NKR_SURV_STAGES) &&
      nrow(dplyr::distinct(cells, period, years, age, stage)) == nrow(cells),
    "a valid NKR survival cell came back without a number" =
      !anyNA(cells$survival[valid]) && !anyNA(cells$at_risk[valid]),
    # the check that year k is k-year survival, not the survival of year k alone
    "NKR's survival at diagnosis is not 100%" =
      isTRUE(all.equal(cells$survival[valid & cells$years == 0],
                       rep(100, sum(valid & cells$years == 0)))))

  cells |>
    dplyr::select(-state) |>
    dplyr::mutate(site = site, sex = NKR_SURV_SEXES[[sex]], .before = 1)
}

# ---- WHO: the Netherlands ------------------------------------------------------
# blog: WHO's raw ICD-10 mortality files, cut down to one country.
WHO_BASE <- paste0("https://cdn.who.int/media/docs/default-source/",
                   "world-health-data-platform/mortality-raw-data")
WHO_NL   <- "4210"

# The twelve codes a four-character country-year reports for C18-C20. WHO
# leaves a row out when a cause had no deaths, so the grid is completed against
# this set rather than against whatever rows happen to exist.
WHO_CODES <- c(sprintf("C18%d", 0:9), "C19", "C20")

# WHO's lists that code at four characters. The Netherlands filed its first
# ICD-10 years, 1996-1999, on "10M" and every year since on "104"; both carry
# C18.0-C18.9, which is what is checked below rather than taken from the name.
WHO_DETAILED <- c("104", "10M")

# Deaths1..Deaths26 / Pop1..Pop26 -> the 18 bands:
# slot 1 is the all-ages total and 26 is age unknown, neither of them a band;
# 2..6 fold into 0-4 and 23..25 into 85+, which makes every age format WHO uses
# collapse to the same 18 bands.
BAND_MAP <- c(stats::setNames(rep(1L, 5), 2:6),
              stats::setNames(2:17,       7:22),
              stats::setNames(rep(18L, 3), 23:25))

fetch_who_nl <- function() {
  tmp <- tempfile("who"); dir.create(tmp)
  get_one <- function(name) {
    zip <- file.path(tmp, paste0(name, ".zip"))
    curl::curl_download(paste0(WHO_BASE, "/", name, ".zip"), zip, quiet = TRUE,
                        handle = ua_handle())
    utils::unzip(zip, exdir = tmp)
  }
  purrr::walk(c(paste0("morticd10_part", 1:6), "mort_pop"), get_one)
  parts <- file.path(tmp, paste0("Morticd10_part", 1:6))
  pop_f <- file.path(tmp, "pop")
  stopifnot("a WHO archive does not hold the file this reader expects" =
              all(file.exists(c(parts, pop_f))))

  # One country out of ~500 MB: keep its lines as text first and parse only
  # those, rather than parsing every country to throw all but one away.
  read_country <- function(f) {
    x <- readr::read_lines(f, progress = FALSE)
    readr::read_csv(I(c(x[1], x[startsWith(x, paste0(WHO_NL, ","))])),
                    col_types = readr::cols(.default = readr::col_character()),
                    progress = FALSE)
  }

  all_nl <- purrr::map(parts, read_country) |>
    purrr::list_rbind() |>
    dplyr::mutate(Year = as.integer(Year)) |>
    dplyr::filter(Year >= NL_FIRST_YEAR)

  raw <- all_nl |> dplyr::filter(stringr::str_detect(Cause, "^C1[89]|^C20"))

  # Every year used must code C18 at four characters: that is what makes the
  # twelve codes the vocabulary, and what lets the appendix (C18.1) be taken
  # out at all. A three-character C18 anywhere would break both.
  stopifnot(
    "a Dutch WHO year is on a list that does not code at four characters" =
      all(raw$List %in% WHO_DETAILED),
    "a Dutch WHO year reports a three-character C18" = !any(raw$Cause == "C18"),
    "a Dutch WHO colorectal code is outside the twelve expected" =
      all(raw$Cause %in% WHO_CODES),
    "a Dutch WHO year is missing in the middle of the series" =
      all(seq(min(raw$Year), max(raw$Year)) %in% raw$Year),
    "WHO has a Dutch death of a sex other than 1/2" = all(raw$Sex %in% c("1", "2")))

  long <- raw |>
    tidyr::pivot_longer(
      tidyselect::matches("^Deaths([2-9]|1[0-9]|2[0-6])$"),
      names_to = "slot", values_to = "deaths",
      names_transform = list(slot = \(x) as.integer(sub("Deaths", "", x)))) |>
    dplyr::mutate(deaths = tidyr::replace_na(as.numeric(deaths), 0))

  stopifnot("WHO age bands do not sum to the published all-ages total" =
              isTRUE(all.equal(sum(long$deaths),
                               sum(as.numeric(raw$Deaths1), na.rm = TRUE))))

  deaths <- long |>
    dplyr::filter(slot %in% as.integer(names(BAND_MAP))) |>
    dplyr::transmute(year = Year, list = List,
                     sex = sex_labels[as.integer(Sex)],
                     agegrp = unname(BAND_MAP[as.character(slot)]),
                     code = Cause, deaths) |>
    dplyr::summarise(deaths = sum(deaths), .by = c(year, list, sex, agegrp, code)) |>
    tidyr::complete(tidyr::nesting(year, list), sex = sex_labels,
                    agegrp = seq_len(N_AGEGRP), code = WHO_CODES,
                    fill = list(deaths = 0))

  unknown <- long |>
    dplyr::filter(slot == 26) |>
    dplyr::summarise(unknown = sum(deaths), .by = Year) |>
    dplyr::rename(year = Year)

  who_pop <- readr::read_csv(pop_f, col_types = readr::cols(.default = readr::col_character()),
                             progress = FALSE) |>
    dplyr::filter(Country == WHO_NL, Sex %in% c("1", "2")) |>
    dplyr::mutate(Year = as.integer(Year)) |>
    dplyr::filter(Year >= NL_FIRST_YEAR) |>
    tidyr::pivot_longer(
      tidyselect::matches("^Pop([2-9]|1[0-9]|2[0-5])$"),
      names_to = "slot", values_to = "pop",
      names_transform = list(slot = \(x) as.integer(sub("Pop", "", x)))) |>
    dplyr::transmute(year = Year, sex = sex_labels[as.integer(Sex)],
                     agegrp = unname(BAND_MAP[as.character(slot)]),
                     pop = tidyr::replace_na(as.numeric(pop), 0)) |>
    dplyr::summarise(pop = sum(pop), .by = c(year, sex, agegrp))

  # C26, "other and ill-defined digestive organs". C26.0 is "intestinal tract,
  # part unspecified", where a death certified only as bowel cancer ends up, so
  # it is the one code outside C18-C20 that may hold colorectal deaths. Kept at
  # whatever detail WHO has, by the same age bands, completed like the deaths.
  death_years <- unique(deaths$year)
  c26 <- all_nl |>
    dplyr::filter(stringr::str_detect(Cause, "^C26"), Sex %in% c("1", "2")) |>
    tidyr::pivot_longer(
      tidyselect::matches("^Deaths([2-9]|1[0-9]|2[0-6])$"),
      names_to = "slot", values_to = "deaths",
      names_transform = list(slot = \(x) as.integer(sub("Deaths", "", x)))) |>
    dplyr::mutate(deaths = tidyr::replace_na(as.numeric(deaths), 0)) |>
    dplyr::filter(slot %in% as.integer(names(BAND_MAP))) |>
    dplyr::transmute(year = Year, sex = sex_labels[as.integer(Sex)],
                     agegrp = unname(BAND_MAP[as.character(slot)]),
                     code = Cause, deaths) |>
    dplyr::summarise(deaths = sum(deaths), .by = c(year, sex, agegrp, code)) |>
    tidyr::complete(year = death_years, sex = sex_labels,
                    agegrp = seq_len(N_AGEGRP), code,
                    fill = list(deaths = 0))

  list(deaths = deaths, who_pop = who_pop, unknown = unknown, c26 = c26)
}

# ---- CBS StatLine: population --------------------------------------------------
# Table 03759ned, through the OData v3 API (no key). The dimension keys are
# padded to a fixed width -- "NL01  ", "3000   " -- and a filter on the bare
# key matches nothing, so the keys are written out padded.
#
# WHICH population. The table offers two, and the obvious one is wrong here.
# Its "gemiddelde bevolking" (average population) at age L is the cohort that
# turns L during the year -- CBS defines it as (aged L-1 on 1 January + aged L
# on 31 December) / 2 -- so its ages run half a year older than the age at
# diagnosis or death that NKR and WHO count. Against those numerators it puts
# too many people in every old band and too few in 0-4, and an all-ages ASR
# comes out about 2% low. The population used instead is the 1 January
# population at age L, averaged over 1 January of the year and of the next:
# the people at that same age at the start and at the end of the year, which
# is what a mid-year population by age is. With it, the Segi ASR of the NKR
# counts reproduces the WSR NKR publishes to within 0.05% in every final year
# (checked October 2026; blog: the check is redone in the post).
# WHO's own Dutch population is this same series too, except around 2018-2020,
# where its split by age departs from it by up to 18% -- so it is kept only for
# that comparison.
CBS_URL <- "https://opendata.cbs.nl/ODataApi/odata/03759ned"

fetch_cbs <- function() {
  get_json <- function(url, query = list()) {
    h <- ua_handle()
    u <- if (length(query)) paste0(url, "?", paste(
      names(query), vapply(query, curl::curl_escape, ""), sep = "=", collapse = "&"))
      else url
    res <- curl::curl_fetch_memory(u, handle = h)
    if (res$status_code != 200) stop("CBS answered ", res$status_code)
    jsonlite::fromJSON(rawToChar(res$content))$value
  }

  ages <- tibble::as_tibble(get_json(paste0(CBS_URL, "/Leeftijd"))) |>
    dplyr::transmute(Leeftijd = trimws(Key), title = Title)

  d <- tibble::as_tibble(get_json(paste0(CBS_URL, "/TypedDataSet"), list(
    `$filter` = paste("RegioS eq 'NL01  ' and BurgerlijkeStaat eq 'T001019'",
                      "and (Geslacht eq '3000   ' or Geslacht eq '4000   ')"),
    `$select` = "Geslacht,Leeftijd,Perioden,BevolkingOp1Januari_1"))) |>
    dplyr::mutate(dplyr::across(c(Geslacht, Leeftijd), trimws),
                  jan1 = as.integer(substr(Perioden, 1, 4))) |>
    # 1 January of the first year is needed, and of the year after the last
    dplyr::filter(jan1 >= NL_FIRST_YEAR, !is.na(BevolkingOp1Januari_1)) |>
    dplyr::left_join(ages, by = "Leeftijd") |>
    dplyr::mutate(sex = dplyr::if_else(Geslacht == "3000", "Men", "Women"),
                  single = suppressWarnings(as.integer(
                    sub("^(\\d+) jaar$", "\\1", title))),
                  pop = BevolkingOp1Januari_1)

  # The table holds single years of age, an all-ages total, AND open bands
  # ("95 jaar of ouder", "105 jaar of ouder") that overlap the single years. So
  # the bands 0-4 .. 80-84 are built from single years 0..84 only, and 85+ is
  # the total minus those -- which does not depend on how CBS happens to split
  # the oldest ages in a given year.
  single <- d |> dplyr::filter(!is.na(single), single <= 84)
  total  <- d |> dplyr::filter(title == "Totaal") |>
    dplyr::select(jan1, sex, total = pop)

  stopifnot(
    "CBS is missing a single year of age below 85" =
      all(dplyr::count(single, jan1, sex)$n == 85L),
    "CBS has no all-ages total for a year" =
      nrow(total) == nrow(dplyr::distinct(single, jan1, sex)))

  bands <- single |>
    dplyr::mutate(agegrp = single %/% 5L + 1L) |>
    dplyr::summarise(pop = sum(pop), .by = c(jan1, sex, agegrp))

  old <- bands |>
    dplyr::summarise(under85 = sum(pop), .by = c(jan1, sex)) |>
    dplyr::inner_join(total, by = c("jan1", "sex")) |>
    dplyr::transmute(jan1, sex, agegrp = N_AGEGRP, pop = total - under85)

  stopifnot("CBS 85+ came out at zero or below" = all(old$pop > 0))

  stocks <- dplyr::bind_rows(bands, old) |> dplyr::mutate(agegrp = as.integer(agegrp))

  # Year t's population is the mean of the stocks on 1 January t and 1 January
  # t+1, at the same age. An inner join, so a year is only produced once the
  # following 1 January is published.
  dplyr::inner_join(
    stocks |> dplyr::rename(year = jan1, start = pop),
    stocks |> dplyr::transmute(year = jan1 - 1L, sex, agegrp, end = pop),
    by = c("year", "sex", "agegrp")) |>
    dplyr::transmute(year, sex, agegrp, pop = (start + end) / 2) |>
    dplyr::arrange(year, sex, agegrp)
}

# ---- read the cache, or build it, one source at a time ----------------------------
nl_nkr <- nl_cached("nkr", fetch_nkr)
nl_stage <- nl_cached("stage", \() list(stage = nkr_fetch_stage(
  nkr_years() |> dplyr::filter(year >= NL_FIRST_YEAR), nl_nkr$nkr)))
nl_surv <- nl_cached("surv", \() list(survival = tidyr::expand_grid(
  site = names(NKR_STAGE_SITES), sex = names(NKR_SURV_SEXES)) |>
  purrr::pmap(nkr_fetch_survival) |>
  purrr::list_rbind()))
nl_who <- nl_cached("who", fetch_who_nl)
nl_cbs <- nl_cached("cbs", \() list(cbs_pop = fetch_cbs()))

stopifnot(
  "CBS bands do not tile 0-85+" =
    all(dplyr::count(nl_cbs$cbs_pop, year, sex)$n == N_AGEGRP),
  "WHO has Dutch deaths of unknown age, which no band would hold" =
    sum(nl_who$unknown$unknown) == 0)

# ---- the count tables, each count with its population ---------------------------
# One row per year x sex x age group x code, rectangular, with `pop` repeated
# across the codes of a cell.
# blog: the report put these in the shape of the ICBP files, with a country and
# jurisdiction column; one country needs neither.
with_pop <- function(d) {
  out <- d |>
    dplyr::left_join(nl_cbs$cbs_pop, by = c("year", "sex", "agegrp")) |>
    dplyr::transmute(year, sex, agegrp = as.integer(agegrp), code, cases, pop)
  stopifnot("a Dutch count has no CBS population under it" = !anyNA(out$pop))
  out
}

keep_final <- \(d) d |>
  dplyr::filter(NKR_KEEP_PRELIMINARY | !preliminary) |>
  dplyr::select(-preliminary)

inc_codes <- nl_nkr$nkr |> keep_final() |> with_pop()
net_codes <- nl_nkr$net |> keep_final() |> with_pop()

mort_codes <- nl_who$deaths |>
  dplyr::select(year, sex, agegrp, code, cases = deaths) |>
  with_pop()

c26_codes <- nl_who$c26 |>
  dplyr::select(year, sex, agegrp, code, cases = deaths) |>
  with_pop()