Most metabolomic work in epidemiology examines how individual metabolites or other small molecules (such as xenobiotics like PFAS) relate to health outcomes. But we can also study the relative relationships between these molecules and how those relate to health. These ratios may be more biologically informative than single metabolites alone, as they may better reflect the underlying biochemical processes we’re trying to understand. As I finish writing my dissertation – which has relied primarily on single metabolite analyses – I’ve been thinking about how ratios offer a simple complement to that approach. In this blog post, I’ll explore the use of metabolite ratios in epidemiological studies, along with methodological challenges they may present.
What can ratios capture?
To understand why we concern ourselves with the added statistical complexities of ratios, one must first appreciate the (theoretical) utility of the metabolite ratios. Namely, levels of metabolites are not static as they are always in flux and these dynamics are governed by enzymatic kinetics. Single metabolite analyses do not capture these dynamics. In some scenarios, this limitation does not pose a problem. For example, if the molecule serves as a marker of exogenous exposure (e.g. cotinine and nicotine levels reflecting smoking), or when absolute concentration itself drives toxicity (e.g. uric acid crystals in gout), the absolute level of the metabolite will likely suffice to study their relationship with health. But sometimes the actual biology can be better captured by the production and clearance rates of the metabolite. Because in a homeostatic system like the human body, the absolute level can be misleading as compensatory mechanisms may maintain the levels despite dysfunction in the pathway. In other words, if you only take the absolute levels into account in a homeostatic system, you can miss the ‘effort’ it took to keep it there.
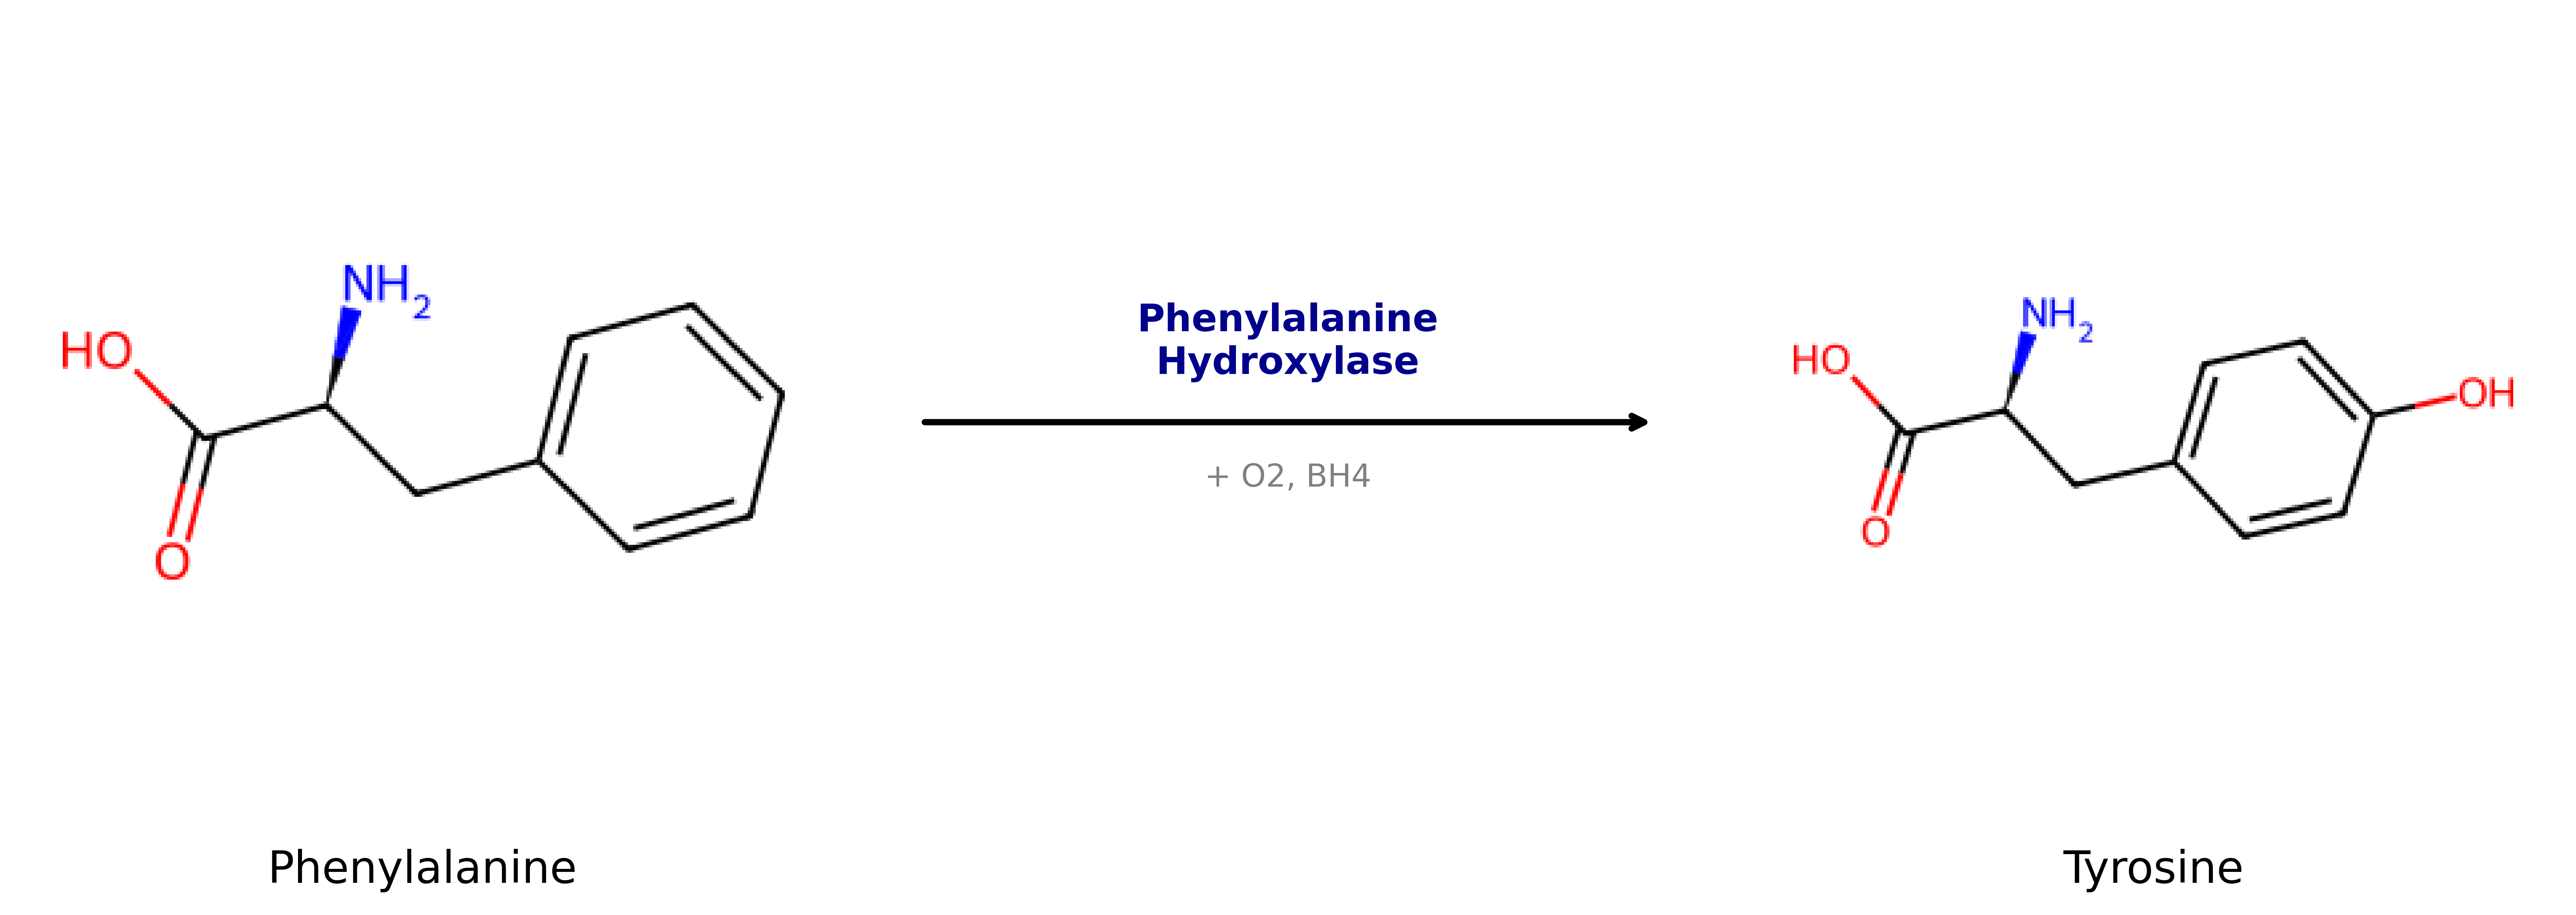
While we cannot measure these rates comprehensively in our epidemiological single sample studies, we think we can get a useful proxy of such processes by looking at the ratio of metabolites. For example, the ratio of phenylalanine to its hydroxylated product, tyrosine, can serve as a direct proxy for the activity of the enzyme phenylalanine hydroxylase. A ratio can, in theory, also normalize for a low input as sometimes low levels may simply reflect low dietary intake rather than metabolic dysfunction. Or, if one of the small molecules is a xenobiotic, we obtain proxies for the detoxification capacity (e.g. absorption, distribution, metabolism, excretion).
The ratio of a product to its substrate (product/substrate) can reflect the activity of the enzyme connecting them.
More generally these ratios of product to substrate may capture the binding affinity or reaction rate (McCaw et al. (2025)). Beyond direct neighbours in a pathway, ratios of metabolites within the same pathway can serve as indicators of overall pathway efficiency or reveal ‘traffic jams’ where specific bottlenecks serve as rate-limiting steps.
Ratios of metabolites across different pathways seem harder to conceptualize – and cross-talk between pathways means the boundaries are not always clear. Still, these ratios could capture systemic coordination such as the competition for shared cofactors (like ATP or NADH) or reflect the global balance between building up (anabolism) and breaking down (catabolism) processes in the body.
Fundamentally, these ratios may proxy for flux distribution, approximating the movement of molecules through the system. They can help us translate a static chemical snapshot into a (albeit crude) measure of dynamic biological efficiency (Fearnley and Inouye (2016)).1
Proteomics, importantly, does not measure this as it measures protein levels instead of the proxy of enzyme activity we try to obtain here.
Challenges
Now to systematically investigate the relationship of these ratios (using measurements from untargeted platforms) to health, genes and the like, I identified several possible challenges:
Fundamental statistical challenges
The use of ratios in regression raises fundamental statistical questions. This discussion goes back to Pearson (1897) when he noted that uncorrelated variables become correlated when they share a common denominator. More recent discussions (e.g Allison et al. (1995), Kronmal (1993), McCaw et al. (2025)) highlight that a regression result need not be specific to the ratio per se as a mixture of signals associated with the numerator or denominator can give rise to an association with a ratio. Therefore, some recommend to always place your ratio results into the context of the marginal models (i.e. numerator or denominator only – (McCaw et al. (2025))), or to calculate some ‘p-gain’ statistic (Petersen et al. (2012)).2 Relatedly, such a mixture of signal problem complicates causal inference concepts such as the consistency assumption (Mooldijk et al. (2025)).
Moreover, statisticians point to the strong parametric assumptions that a ratio makes as a ratio is implicitly an interaction between one variable and the reciprocal of another variable. This is often done without modeling the main effects – implicitly assuming that these do not affect the outcome.
Metabolite specific statistical challenges
Explosion of tests
If our platform provides us with information on the intensity of 400 molecules and we want to study all the ratios this amounts to 79800 tests (\(\frac{n(n-1)}{2}\)). That’s a lot! And while that is not necessarily a statistical problem3, I suspect that – based on the previous section – we can come up with general, promising classes of ratios to prioritize. For example, known substrate-product pairs from high confidence reactions, and all pairwise ratios within a pathway, or of a pro-inflammatory product to its precursor, are much more promising than the ratio of metabolites that are not known to be connected by an edge in a network. For xenobiotics, prioritising beyond oxidized/non-oxidized forms, becomes challenging as xenobiotics lack pathway structure. We could calculate all ratios to still allow for the study of ADME and toxicokinetic processes. Depending on the exact research question, we can perform a series of univariable tests and control for multiple testing (separately by each of these categories), or we can perform variable selection using a computationally efficient statistical procedure of lasso for ratios as proposed by Bates and Tibshirani (2019).
Change in preprocessing
I have written before how to preprocess the metabolomic data for epidemiological studies. This process involves removing technical variation such as batch effects and imputing observations below the limit of detection using an imputation model. For ratios, this process likely needs tweaking. Fortunately, Morris et al. (2014) showed that passive imputation, where we impute the log-transformed numerator and denominator as individual variables (allowing the imputation model to utilize the correlation between them) and only then derive the ratio of interest from these values, is a robust strategy. I think we can readily translate this to our metabolomic pipeline4, by doing the following:
Log-transform our variables.
Fit a left-censored model with for example random intercepts, to model the technical variation.
Remove the technical variation.
For both the numerator and denominator, generate multiple imputations below the-technical-variation-adjusted-limit-of-detection using a chained equation procedure with for example mice.
Fit the regression model of interest with the ratio term specified as I(log_numerator - log_denominator).
Pool our multiple estimates using Rubin’s rules.
Only step 4 – where we invoke mice – and step 5 are a slight tweak really. Since this pipeline is somewhat computationally intensive, prioritizing certain ratio categories matters not only for managing multiple testing but also for managing computational cost.
Measurement error propagation
A final statistical challenge (specific to metabolites) involves (technical) measurement error propagation (e.g. Holmes and Buhr (2007)). While this is less of a concern for ratios based on robust measurements like body-mass-index, it is critical when dealing with measurements from biological assays. Untargeted high-throughput mass spectrometry, for example, can contain considerable technical variation. While we can capture systematic batch effects through regression models, subtle technical variation that operates beyond simple intercept shifts may be harder to systematically address.5
The extent of this challenge depends on whether the error is shared across the numerator and denominator. Theoretically, if the technical error is highly correlated, taking a ratio acts as a normalization step, effectively cancelling out the noise. However, if the errors are independent – and this is not entirely unlikely in metabolomics – they compound (pun intended) and the resulting ratio will contain more noise than the individual components. I think that this problem can become particularly severe when the denominator is small or near the limit of detection as dividing by an imprecisely measured small number causes the variance of the ratio to explode, potentially creating artificial outliers. Though the log-transformation often applied to metabolic data will probably mitigate the worst of this.
Isomers
Isomers are compounds that share the same chemical formula (and mass) but differ in structural arrangement. Because untargeted mass spectrometry detects mass, it cannot distinguish between these molecules unless they are physically separated before detection. This is typically achieved by coupling the spectrometer to a (liquid) chromatograph. However, separation fails when isomers share similar physicochemical properties such as polarity and hydrophobicity. In these cases, the molecules interact with the column in nearly identical ways, causing them to elute at the same time (co-elution).
Structural arrangement can have important implications for biological function: leucine and isoleucine – despite identical mass – play distinct roles in protein synthesis and metabolic regulation as glucose and fructose trigger different insulin responses and metabolic pathways. When these classic examples co-elute, the measured signal reflects the sum of both compounds. While problematic for single metabolite analyses, this aggregation is also damaging for ratios: a ratio involving a co-eluted isomer is now a muddied variable instead of a clean readout of a specific enzyme’s efficiency. As such, it reflects the ratio probably does not reflect anything biological.
Even popular targeted kits are not immune to this problem. For example, the Biocrates AbsoluteIDQ p180 kit does not allow for detailed analysis of the exact lipid composition of metabolites such as PC ae C32:2. In this case, distinct lipid species with different biological roles are aggregated into a sum, making specific product-to-substrate inferences risky as interpretation carries considerable uncertainty. While future technologies like Ion Mobility Spectrometry (IMS) may offer better separation, current chatter suggests they are not a panacea.
Existing literature
There is a considerable body of applied literature that uses ratios of metabolites (to study health). For example, pharmacokineticists can use ratios as a measure of drug clearance, and epidemiologists can use ratios as a marker of detoxification ability. But the most substantial body of literature that uses ratios to study health at scale seems to be from genetic epidemiology. Given that genes can code for enzymes this is hardly a surprise.
This approach began with Gieger et al. (2008), and these research groups from Helmholtz Zentrum have been its strongest proponents by far since (e.g., Petersen et al. (2012), Kastenmüller et al. (2015), Suhre, Raffler, and Kastenmüller (2016)).6 While metabolomic and genomic data is expensive to generate, it is surprising to see that it has not spread much beyond these groups. Is there something more fundamental that I’m missing? Or is the market of ideas simply not that efficient?
In these analyses, ratios nearly always serve as outcomes. However, ratios also function as exposures7 when researchers conduct Mendelian randomization on diseases after establishing ratio-gene associations, since the predicted values of ratios are used in the underlying instrumental variable calculations.
A recent preprint from Sadegh Rizi et al. (2025) shows us that you can even do all of this without calculating ratios explicitly! By simply using the rules of logarithms, the paper calculates the association of genes with ratios while only having access to the summary statistics of a past genetic analysis of single metabolites.8 Computationally, this also allows them to calculate the association of all loci with all ratios as without the summary statistics they would have needed to develop an efficient genome-wide mixed-effect model. Overall, their results suggest a gene that is involved in the excretion of PFOS in humans, and – using MR on the statistically significant ratios – suggest several ratios that are likely causal biomarkers for diseases.
Epilogue
Beyond direct results, what can we learn from this literature, particularly the recent preprint by Sadegh Rizi et al. (2025)? A few things stand out.
First, these ratios do really seem to capture enzyme activity. Second, many significant ratio-gene associations involve metabolites that aren’t known substrate-product pairs or even direct pathway neighbors – suggesting that my biologically informed prioritization alone would have missed a lot. Even with their stringent statistical thresholds, the sheer number of results hints at more signal than I initially expected. This makes me very excited for the future as more metabolomic data paired with genetic data becomes increasingly available in cohorts.
Third, the authors excluded isomers, which validates a challenge I’d identified earlier. Fourth, the underlying summary statistics came from a study that didn’t specifically optimize preprocessing for ratio analysis. In my own metabolomic work, I’ve seen how (largely) ignoring (the intertwined nature of) technical variation and left-censoring can create artifacts, and I’d expect ratios to be even more sensitive to these choices.
That said, some associations have replicated across studies with seemingly different preprocessing strategies. For instance, the negative effect of the C allele at rs1260326 on the glucose/mannose ratio shows up in Chen et al. (2023), Suhre et al. (2011), and Shin et al. (2014). Maybe preprocessing matters less than I think – at least for larger effects. Or maybe it only matters on the margin. Time will hopefully tell.
Bates, Stephen, and Robert Tibshirani. 2019. “Log-RatioLasso: Scalable, SparseEstimation for Log-RatioModels.”Biometrics 75 (2): 613–24. doi:10.1111/biom.12995.
Chen, Yiheng et al. 2023. “Genomic Atlas of the Plasma Metabolome Prioritizes Metabolites Implicated in Human Diseases.”Nature Genetics 55 (1): 44–53. doi:10.1038/s41588-022-01270-1.
Fearnley, Liam G, and Michael Inouye. 2016. “Metabolomics in Epidemiology: From Metabolite Concentrations to Integrative Reaction Networks.”International Journal of Epidemiology 45 (5): 1319–28. doi:10.1093/ije/dyw046.
Gieger, Christian et al. 2008. “Genetics Meets Metabolomics: A Genome-Wide Association Study of Metabolite Profiles in Human Serum.”PLoS Genetics 4 (11): e1000282. doi:10.1371/journal.pgen.1000282.
Holmes, Daniel T., and Kevin A. Buhr. 2007. “Error Propagation in Calculated Ratios.”Clinical Biochemistry 40 (9-10): 728–34. doi:10.1016/j.clinbiochem.2006.12.014.
Kastenmüller, Gabi et al. 2015. “Genetics of Human Metabolism: An Update.”Human Molecular Genetics 24 (R1): R93–101. doi:10.1093/hmg/ddv263.
Kronmal, Richard A. 1993. “Spurious Correlation and the Fallacy of the RatioStandardRevisited.”Journal of the Royal Statistical Society. Series A (Statistics in Society) 156 (3): 379–92. doi:10.2307/2983064.
McCaw, Zachary R et al. 2025. “Pitfalls in Performing Genome-Wide Association Studies on Ratio Traits.”Human Genetics and Genomics Advances 6 (2): 100406. doi:10.1016/j.xhgg.2025.100406.
Mooldijk, Sanne S et al. 2025. “Ratios in Regression Analyses with Causal Questions.”American Journal of Epidemiology 194 (1): 311–13. doi:10.1093/aje/kwae162.
Morris, Tim P et al. 2014. “Multiple Imputation for an Incomplete Covariate That Is a Ratio.”Statistics in Medicine 33 (1): 88–104. doi:10.1002/sim.5935.
Pearson, Karl. 1897. “Mathematical Contributions to the Theory of Evolution.—On a Form of Spurious Correlation Which May Arise When Indices Are Used in the Measurement of Organs.”Proceedings of the Royal Society of London 60 (359-367): 489–98. doi:10.1098/rspl.1896.0076.
Petersen, Ann-Kristin et al. 2012. “On the Hypothesis-Free Testing of Metabolite Ratios in Genome-Wide and Metabolome-Wide Association Studies.”BMC Bioinformatics 13 (1): 120. doi:10.1186/1471-2105-13-120.
Sadegh Rizi et al. 2025. “Comprehensive Metabolite Ratio QTL Mapping Reveals Disease Relevant Enzyme Biology.” medRxiv. doi:10.64898/2025.12.04.25341616.
Sekula, Peggy et al. 2016. “A Metabolome-WideAssociationStudy of KidneyFunction and Disease in the GeneralPopulation.”Journal of the American Society of Nephrology 27 (4): 1175. doi:10.1681/ASN.2014111099.
Shin, So-Youn et al. 2014. “An Atlas of Genetic Influences on Human Blood Metabolites.”Nature Genetics 46 (6): 543–50. doi:10.1038/ng.2982.
Suhre, Karsten et al. 2011. “Human Metabolic Individuality in Biomedical and Pharmaceutical Research.”Nature 477 (7362): 54–60. doi:10.1038/nature10354.
Suhre, Karsten. 2024. “Genetic Associations with Ratios Between Protein Levels Detect New pQTLs and Reveal Protein-Protein Interactions.”Cell Genomics 4 (3). doi:10.1016/j.xgen.2024.100506.
Suhre, Karsten, Johannes Raffler, and Gabi Kastenmüller. 2016. “Biochemical Insights from Population Studies with Genetics and Metabolomics.”Archives of Biochemistry and Biophysics 589 (January): 168–76. doi:10.1016/j.abb.2015.09.023.
Footnotes
The supplement of Shin et al. (2014) lists various biological interpretations of a SNP with a ratio.↩︎
Recently there was some discussion over a statistical technique in metascience that was developed without deep involvement from experts in statistics. Now, the p-gain statistic seems quite simple and some vetting (i.e. Petersen et al. (2012)) has been done so there is probably not much wrong with it, but the discussion has left me more suspicious about such techniques..↩︎
Beyond multiple testing it, of course, also poses a computational burden that can make large-scale studies very expensive or even impossible.↩︎
Exact considerations may depend on whether the ratio is an outcome, exposure or covariate. What I described seems tailored to the ratio as exposure. There’s also the multivariate model proposed by McCaw et al. (2025) that I want to explore further in the context of metabolomic data.↩︎
Someday, I will write a blog post on the anatomy of technical variation in untargeted mass spectrometry. I will link it here then.↩︎
Initially, one of their arguments was that these analyses have much greater statistical power. But as McCaw et al. (2025) pointed out, this is of course not a fair comparison as a GWAS of ratios will be sensitive to signals from either of the component traits, whereas the GWAS of single metabolites will be sensitive to signals from only one specific trait.↩︎
I mention this because considerations of ratios can depend on whether it’s an exposure, covariate, or outcome (Mooldijk et al. (2025)).↩︎
Based on an observation from Suhre (2024), although Sekula et al. (2016) also seemingly noted the same before.↩︎
Citation
BibTeX citation:
@online{oosterwegel2026,
  author = {Oosterwegel, Max J.},
  title = {Reflections on Metabolite Ratios},
  date = {2026-01-26},
  url = {https://maxoosterwegel.com/blog/metabolite-ratios/},
  doi = {placeholder},
  langid = {en}
}
For attribution, please cite this work as:
Oosterwegel, Max J. 2026. “Reflections on Metabolite
Ratios.” January 26. doi:placeholder.